Alma Analytics
V2.6 updated October 2023
Introduction
Alma Analytics is a tool used to gather data in a meaningful format in order to answer specific business questions about how the library is operating. Reports based on different functional areas (known as Subject Areas in Alma Analytics) can be created from scratch, which may include charts and tables displaying relevant data. Several reports can be brought together in a visual dashboard, many of which are available to view from the analytics menu. When combined, these elements can help us to answer questions we might have about a variety of areas within the library.
Reports can be created from various pieces of data stored automatically, which could monitor different areas such as:
- Fulfilment queries, including data about loans, fines and fees
- Acquisitions data, such as vendor information
- Inventory and resource use, for collection management
- User management data, including breakdowns of user groups
There are several areas of information available within the platform which we can use to create reports and dashboards, and this list is by no means exhaustive. New dashboards could be created dependent on our business needs, as the nature and number of the services we provide changes.
Dashboard Overview
Dashboards are the first point of call when trying to locate pieces of data to answer business questions. A number of the frequently required pieces of data within Library Services have been allocated reports with information collated and displayed automatically in tables and charts. These reports have been allocated within dashboards, which are easily accessible and can be exported.
You may find that the answer to your business question lies in one or more of these dashboards, which are available to all Alma users. See below for more information on access to dashboards.
Below is a list of the dashboards available at the time of writing (August 2023), with a list of the reports contained within each dashboard:
Dashboard Name | Purpose | Reports Associated with Dashboard |
Acquisitions | To display information related to acquisitions within the library | Searchable new orders; Searchable requests; Annual Trend; Classifications; Vendors; Material Type; Fund Ledgers; Detailed Expenditures; PO Lines by fiscal year and Type; Transactions by Expenditure and encumbrance per month; Expenditure trends for physical and electronic resources; Book budget; Vendor performance; Invoices by date; High Request Load
|
Click and Collect | To monitor the use of the Click and Collect Service | Recalls by Library; Requests by Library; Requests by User Group; Expired requests; Most popular titles |
Fulfilment | To monitor circulation activity of materials within the library (including laptops) | Circulation Activity; Current Circulation Snapshot; Items Loaned per Patron Group; Item Circulation Statistics; Recalled Items; Laptop Circulation Statistics; Overdue Loans; Loans by Day of Week
|
Inventory | To observe the nature of collections and materials, including statistics to aid weeding processes | Item List by Library and Location; Item Process Type; Item Count; Physical Item Usage for Weeding; Item Additions/Withdrawals; Borrowed X times on Alma; Transit/Missing Items; E&P Overlap (LC & Dewey); Retention Code Report. Please note that an additional Inventory Dashboard Guide has been created to help users navigate these reports. |
| Online Payments | To monitor the fines and fees which our customers are incurring. | Online Payment Report |
| Resource Sharing Requests Dashboard | To monitor borrowing, lending and ILL resource sharing requests. | Rapid ILL; Borrowing resource sharing; Lending resource sharing |
| Scan and Send | To display information related to Scan and Send requests | Digitization requests; Completed digital requests; Completed requests (active, completed, rejected) |
User Management | To monitor the nature of the user groups which make up customers, including new joiners and NHS patrons | Users Report; NHS Registrations; NHS Snapshot; New Joiners
|
Working With Dashboards
Accessing Dashboards
Broadly speaking, most dashboards should be available to most colleagues within the library. Certain, specialised dashboards may limit access based on the Alma roles assigned to your account – if you do not have access to a dashboard and believe you should have access, then please contact the functional lead (Bethan Smith) at alma-analytics-support@ucl.ac.uk.
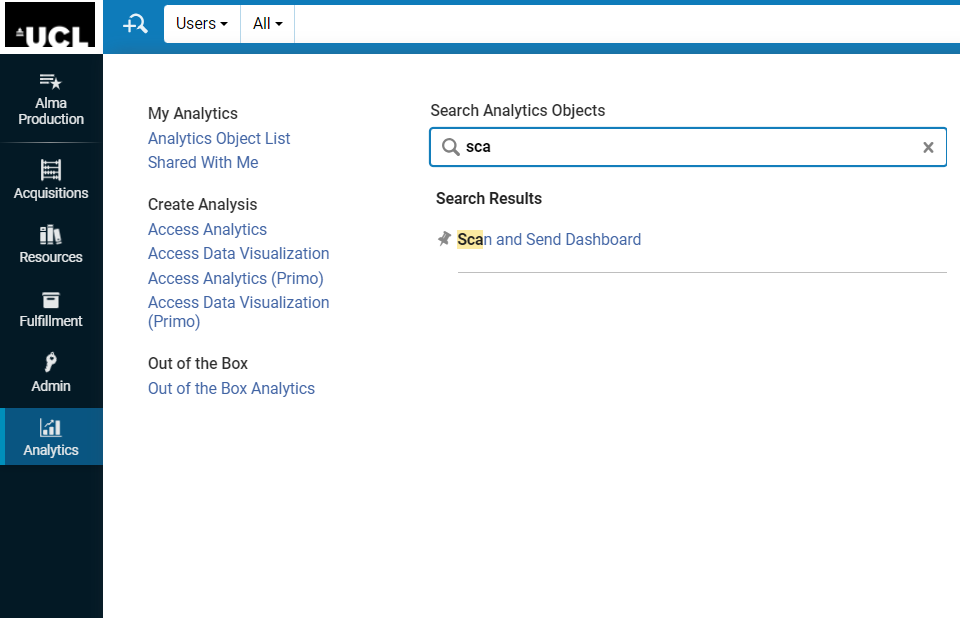
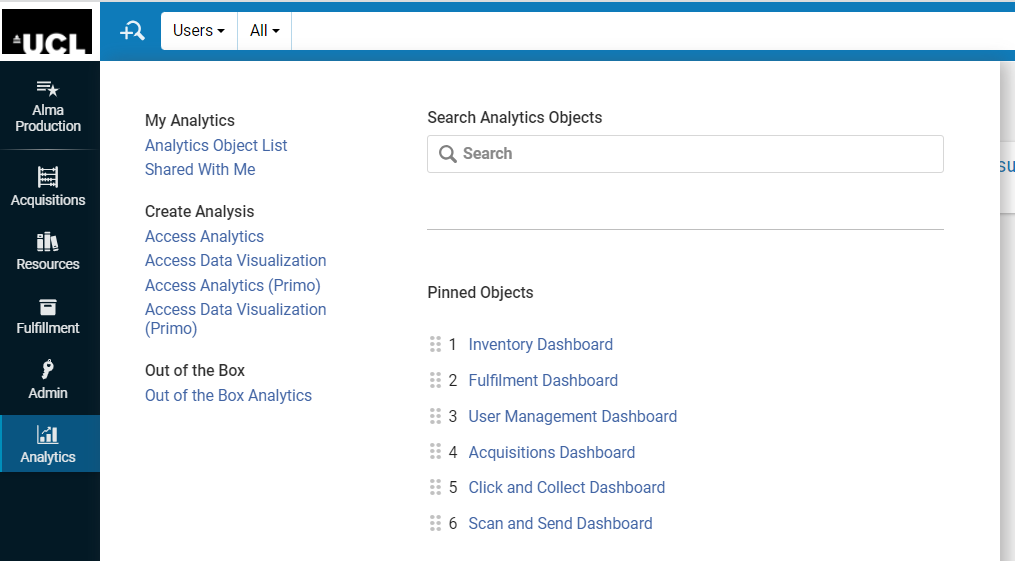
You can access any one of these pre-set dashboards by searching for them in the ‘Analytics’ left-hand side menu. Once you have found a dashboard you wish to use, click the pin icon to the left of the dashboard name to ensure that it remains in your menu:
You can pin as many dashboards as you need to your analytics menu, and these can be rearranged by dragging and dropping them into your preferred order:
Familiarising Yourself with Dashboards
Dashboards usually consist of several reports which have been grouped together. You can toggle between reports in each dashboard by clicking on each individual report tab, such as the reports shown for the Click and Collect Dashboard below:
Reports can contain information displayed in many different formats, including pie charts, bar graphs or tables. A number of these reports will also contain date filters, meaning that you can generate data for a specific timeframe if required.
The best way to get used to the format of dashboards it to take some time to familiarise yourself with the contents of each report within the dashboard, to gain a greater understanding of what data lies within each separate tab, and what business questions are answered within each report.
Downloading a Report from a Dashboard
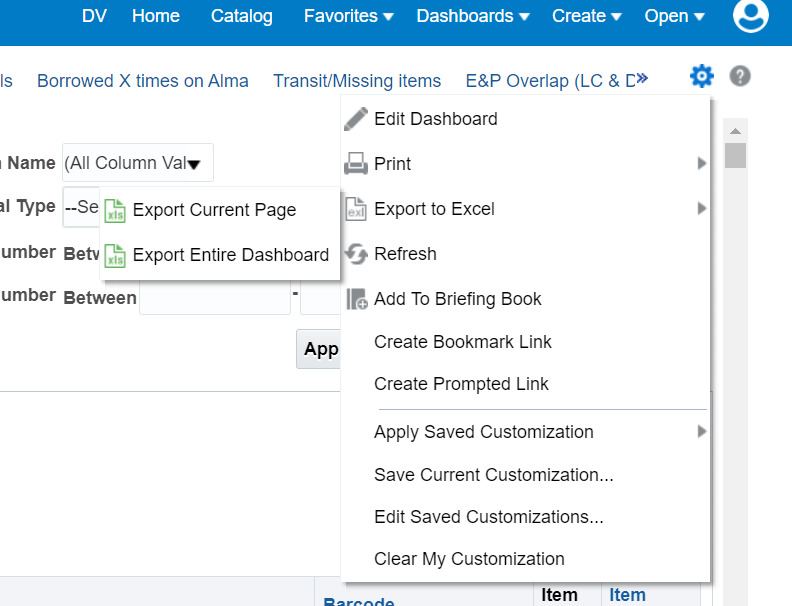
To download a report from the dashboard, select the settings cog (found on the top right side of the report), and then select ‘export to Excel’, as shown below:
You can choose to either download a single report, or the dashboard in its entirety, depending on size – you can download reports which contain up to around 70,000 records. From here, you can also download the report in a variety of other formats, including PDFs and html, by selecting ‘print’ instead of 'export to Excel.
Downloading Unformatted Data from Tables and Objects
If you wish to create export unformatted versions of information, then you will instead need to export data from individual items (e.g. tables) within the reports themselves.
To download an unformatted version of a table, for example, select ‘export’ at the bottom of the item/table, then ‘data’, and select Excel from there:
Or alternatively, for a formatted version of the information in the table only, select ‘formatted’ instead of data, and choose your desired format:
A Note on Downloading Reports
Please be aware that when downloading reports from Alma, it may take some time to do so. It is recommended that you wait until a report has displayed on the page in its entirely before downloading to prevent information from being left off.
Alma will also struggle to download extremely large files, so it is highly recommended that you do not attempt to download entire dashboards.
Making an Amendment to a Dashboard
If you think that a report requires further criteria or improvements – for example a filter, or additional information, or a new report entirely, please suggest this to the functional lead via alma-analytics-support@ucl.ac.uk. The request will then be discussed with the ISD Library Applications team, and suitable changes implemented if there is a suitable business case for the amendment being made.
Reporting Issues
If you have any issues with reports – for example, a glitch, or if something isn’t performing as it should, please email the analytics functional lead in the first instance at alma-analytics-support@ucl.ac.uk, with a clear description of the issues, and screenshots if appropriate. The issue will be escalated to the Library Applications team and, if required, Ex Libris.
Should I Have Access to Design Analytics?
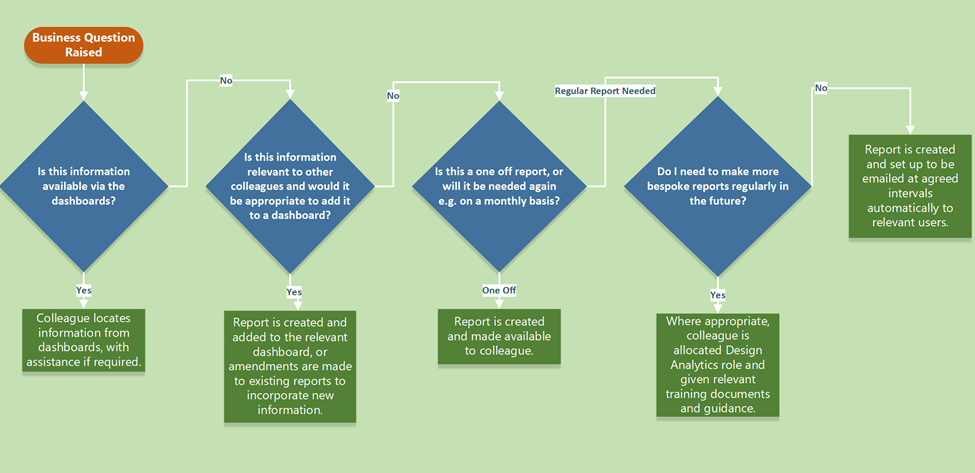
There are a number of routes we can take in order to obtain the data you require. Typically, we only assign the Designs Analytics role to a user if creating bespoke reports is a frequent part of their workflow – that is, if you regularly are required to create unique reports to answer business questions that are not currently displayed in any of the dashboards.
If you need to create occasional reports, or if you require a single report frequently (e.g. a weekly or monthly report), then we will instead consider creating a one off or regularly emailed report, which is explained later in this manual.
If you are in doubt as to what the best option would be for your analysis, the below flowchart provides guidance on when a Design Analytics role should be applied. If you are still unsure about whether you need to have the Design Analytics role added to your account, please contact the functional lead.
Scheduled Reports
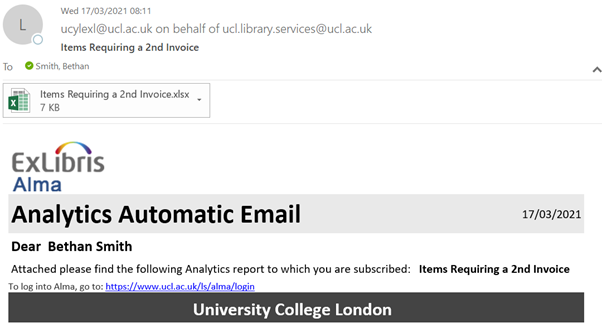
If you need a report regularly that isn’t part of a dashboard, but you do not require a design analytics role, then we can create a bespoke report that is automatically emailed to you at a frequency and time of your choosing (e.g. daily, weekly or monthly on a set date of the month). You can also select which members of staff will receive the report. The report email will be sent as a ‘job’ on Alma, which will be frequently monitored. In the event of an outage, or if a report has been registered as not arriving, the functional lead will be able to examine whether a scheduled job was completed successfully or not.
An email will then be sent to your inbox with an attachment, and will look something like the below screenshot:
To arrange for a scheduled report to be set up, to subscribe to an existing report, or if you are already subscribed to a report and it does not arrive as expected, please contact the functional lead at alma-analytics-support@ucl.ac.uk.
Scheduled reports and GDPR
Please be aware that scheduled reports which are sent via email will need to be GDPR compliant (i.e. not sensitive or personal data relating to customers). If a scheduled report contains such data, it may require an additional dashboard or online report component, which contains both the non-personal and personal data.
Using Design Analytics
If you have been assigned a Designs Analytics role, creating a report for the first time can be confusing! The best way to learn more about creating bespoke reports is to consult the guidance available on the Ex Libris site and to consider conducting your own research.
What follows here is a very brief, introductory guide on how to create a basic analysis from scratch. Please note that if you have not been assigned a design analytics role, you will not be able to create custom reports.
Creating an Analysis
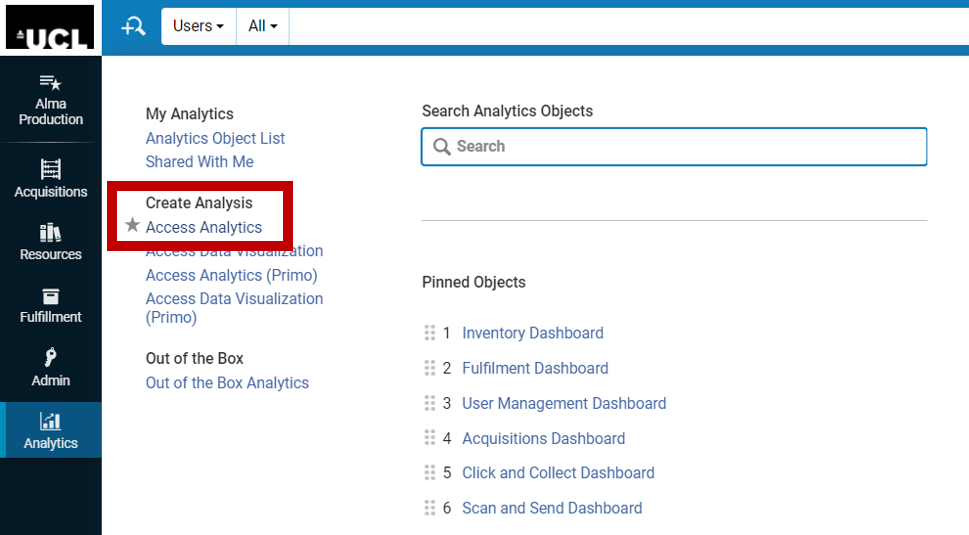
To create a new analysis, you’ll first need to access the Create Analytics area in the Analytics tab. Select 'Access Analytics’:
From there, select ‘Catalog’ in the top right-hand corner:
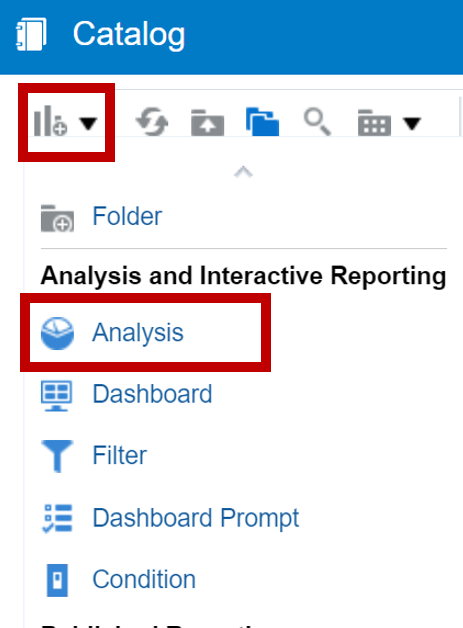
You will then need to select ‘create analysis’ by clicking the graph icon with the plus sign on it on the left-hand side, and selecting 'analysis':
Subject Areas
The data points within analytics are held in ‘subject areas’, which in turn contain a number of folders and fact tables containing individual metrics. For example, the ‘Fulfilment’ subject area contains a folder called ‘Loan Details’, which in turn contains the data point ‘due date’, where we can pull information related to due dates.
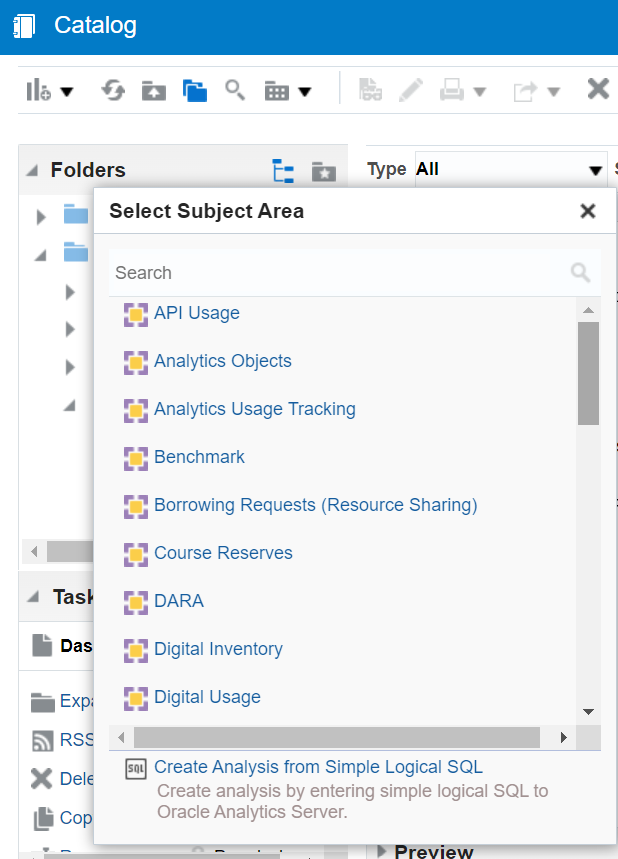
Once you select ‘create analysis’, you will be prompted to select a subject area to generate the report from. Please note that you can select more subject areas later on, after you have created the analysis, but you will need to select at least one to start the process:
Select which subject area you would be most relevant to your requirements. For example, if your need data that relates to understanding user groups, then the subject area ‘user’ may be the most helpful area.
When you have selected a subject area, you will be able to select and explore the folders and data points available within your selects subject area. Once you have decided on which pieces of information you require, you can pull through information to answer your questions, by dragging and dropping the relevant information into the ‘selected columns’ area:
You will then select ‘results’ in order to display the information and check the report has worked.
The above information covers only the very basics of design analytics to get you started. You can perform more actions on the data you collect, such as displaying it in pie charts or tables, and adding filters, including SQLs. Information on how to do this is provided in this in-depth introduction to Analytics on the Ex Libris website.
Saving an Analysis
You can save an analysis once completed to find it again. To do so, select the ‘save as’ icon on the right hand side, as shown below:
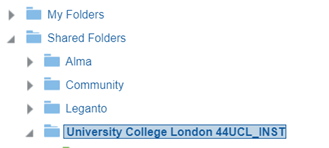
You can then save the report in your personal folder (‘My Folders’), or the institution folder if required. For clarity, the institution folder is known as ‘University College London 44UCL_INST, and can be found under ‘Shared Folders’:
More Information on Design Analytics
If you have been assigned an analytics role and wish to learn more about creating analyses, an in-depth introduction to Analytics can be found on the Ex Libris website.
In addition, this breakdown of Subject Areas on the Ex Libris website may prove useful for understanding what pieces of information are available in each subject area and their folders.
Tips on Design Analytics
- When faced with a complicated query, it can be helpful to break down each component – which pieces of information do you need to answer the question? Are those pieces of information likely to come from the same subject area?
- It is useful to take time to familiarise yourself with each subject area – useful links are available on the Alma pages, such as this breakdown of Subject Areas available on the Ex Libris website.
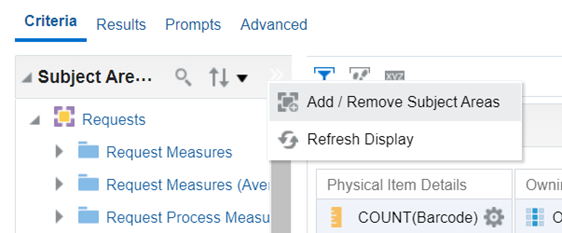
- You can add more than one subject area, for cross-functional reporting, or remove subject areas you don’t need – simply click the >> icon in the Subject Area tab, then select ‘Add / Remove Subject Areas’, as shown below:
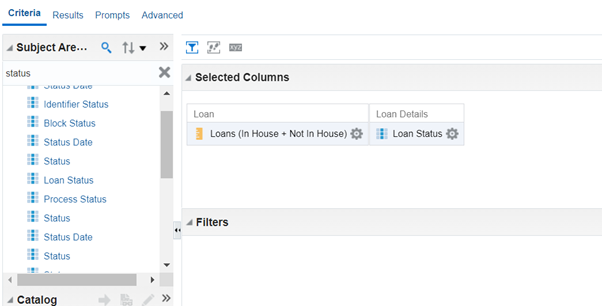
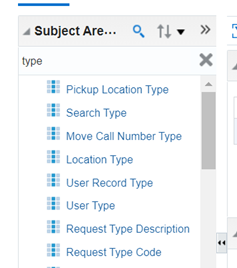
~ - You can perform a key word search to find the correct piece of information within a subject area folder, rather than having to locate the individual item within folders and subfolders. To do this, click on the magnifying glass icon, and type in your search item, as shown below:
This will save a lot of time looking through each folder. Please note that you can only search for folders within subject areas you have already selected (for example, you cannot search for folders in the ‘user’ folder if you only have the ‘borrowing’ subject area open). - Watch out for terminology – UCL Library Services may use slightly different terminology (e.g. fulfilment, circulation, inventory) than Ex Lbiris – and vice versa. If a search result brings up no results, try searching for a synonym.
- Do take a look at what other institutions are doing, and search for support outside of Ex Libris, particularly if you are new to Analytics and find the Ex Libris pages fairly jargon-heavy. YouTube has a lot of analytics videos available, if you prefer a more dynamic way of learning.
- Do not be afraid of trial and error. Sometimes you will select a combination of data points that result in an error message. Keeping an open (and patient!) mind is the best approach.
- Leave plenty of time before a deadline to create your desired report. Contacting the functional lead, who will escalate your query to the LibApps team where required, may take time.
- Do not be afraid to ask for help or advice if needed. The functional lead is there to answer questions and signpost you as needed.
A note on GDPR
Please be aware that reports may contain personally identifiable data (such as names and student IDs). In accordance with GDPR best practice, we should avoid using this data unless it is specifically required to answer our questions. For this reason, it is also not recommended that we email reports which contain such data, in case of a data breach. It is far more secure to create copies of existing reports, or else save them in a secure location and direct others to it.
If you require a scheduled report that contains personal information, please contact the functional lead, who will discuss the best way forward for your needs.
Contact
For any questions, please contact the functional lead – currently Bethan Smith – at alma-analytics-support@ucl.ac.uk.
